
Day 8: Bounce Rate - The Untold Story

Annd..we are on Day 8. Today we are going to talking about the odious bounce rate! I was inspired to write this after seeing several posts on Facebook about people bragging about a 10% Bounce Rate or moaning about their Bounce Rate being 40% (boo hoo for you!).
I will shine some light on how this metric isn’t meant to be a single indication of your blog and/or site is performing, but instead an opportunity to identify what pages or site areas can be better optimized.
In this blog post, I will be reviewing 3 reports you can use to start a new relationship with Bounce Rate. These just scratch the surface of how this metric can open the door to further investigation of the analytics coming from your site.
Even though Bounce Rate is easy to understand, it is even easier to jump to conclusions on what this metric is trying to tell you.
Finally, I want to clarify that this blog post is meant to be more of a beginners guide to Bounce Rate to show how it can be initially actioned; there will be future posts where I go into more detail. So, without further delay, the definition:
Bounce Rate - is the percentage of visits that only had one page view and then left the site.
Sounds simple, right?
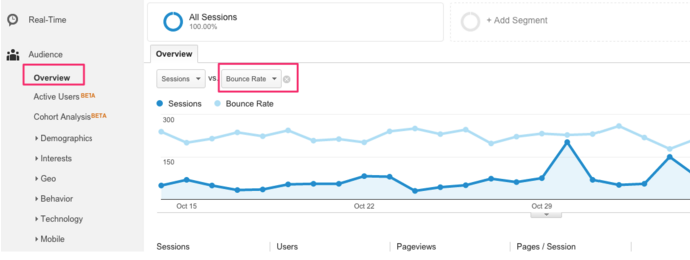
Essentially, what we are capturing here are users who view your site and don’t see anything that attracts them to click deeper. By the way, to see your overall site Bounce Rate, go to Behavior > Overview and add Bounce Rate as the second metric.
Now, you might be asking, what bounce rate number should I be worrying about or celebrating over? Well, my answer might sound unexpected, but I would not hang my happiness and final thoughts of my site performance on a single number coming from Google Analytics. Ever.
As a general recommendation, looking at isolated metrics in Google Analytics and coming to swift conclusions is not the best way to use the tool. That being said, at the end of this post I will give some ranges of good/bad Bounce Rate spaces.
Now, instead of using your Bounce Rate as an all round indicator, my suggestion is to use it as an opportunity to get some important information on not only how your content is performing, but if you are really attracting the right users to your website. Below is a report suggestions to start off with.
Top Performing Content + Bounce Rate
Where to find this report: Behavior > Site Content > All Pages. Like we reviewed previously, you can see Bounce Rate as the 5th metric down.

What to look for in the data: Make sure that you are filtering by top page views (the little arrow beside the “Page Views” metric should be pointing downwards). Here we want to identify if our high traffic content is leading to a lot of bounces and why.
Don’t get depressed if your most popular post has over 50% bounce rate. Instead, consider if there might be users who only come in for that content and then leave. Or if you have external links to other sites.
It’s important not to get obsessed with this single number and instead consider the overall context of the metric.
Another type of page that tends to high a high bounce rate is a splash page or opt in page. This one is obvious but I need to point it out anyway; since these pages are dead ends, it is normal to have high bounce rates on this type of page.
See if you can start to uncover possible answers by looking at your data:
Does my site home page have a 50% plus bounce rate? If so, why would users be pulling away from a navigational point of view? Is your menu clear? Do you clearly ask the user what you want them to do next after viewing your home page?
Next, review top blog content that is getting a high bounce rate. Is there a specific content type (ex. text, video, images) that has a higher bounce rate? Are there certain blog topics that have higher bounce rates? Try and draw a line across several blog posts to get ideas.
Also, identify which pages might have a ‘normal’ high bounce rate: a splash page with a specific opt-in, a shopping cart funnel that ends with a “thank you” page, etc. Try and see your site from a user's point of view and what is the obvious next step.
Possible Next Steps: Once you have become somewhat familiar with your data, and picked out what content you want to focus on, define changes you can make. Some possibilities are:
Reorganize the menu layout. Update copy on home page. Add a button that clearly communicates to the user’s next steps. Make sure to document when any pages are made to then track if this metric changes over time.
Review the latest version of your content calendar and what topics you are covering. Are they similar to any high bouncing pages? If so, try out some new tactics to get users to click on to additional content. Deep links, related posts, categories; these are all tools you can use.
Turn your focus away from splash pages and ‘one hit wonder’ blog posts. If anything, learn from your users in terms of what content they are attracted to and consider redefining your ideal client profile or brainstorming an upcoming product/service.
Are you still curious to know what a “good” bounce rate? According to Avinash Kaushik, Web Analytics Guru at Google, a good bounce rate range in general is 20% to 30%. Anything above 50% requires some serious analysis. Focus on the above questions and draft out changes you can make to track and improve your site experience.
Get familiar with YOUR data and discover what your bounce rate sweet spot is. Starting to build a relationship with your data and using it as your ally is key.
Next up: Day 9! And we are going to talk about Search Keywords (woot!)